Selected infographics

Various clients
Infographics for a variety of clients, on topics such as sufficiency, climate change, natural diversity and indoor air quality.
VisualisationGraphic designInformation design

Project name, client and date, short description and thematic tags.

Graphics for the report “Unfit, Unfair, Unfashionable – Resizing fashion for a fair Consumption space” by the Hot or Cool institute
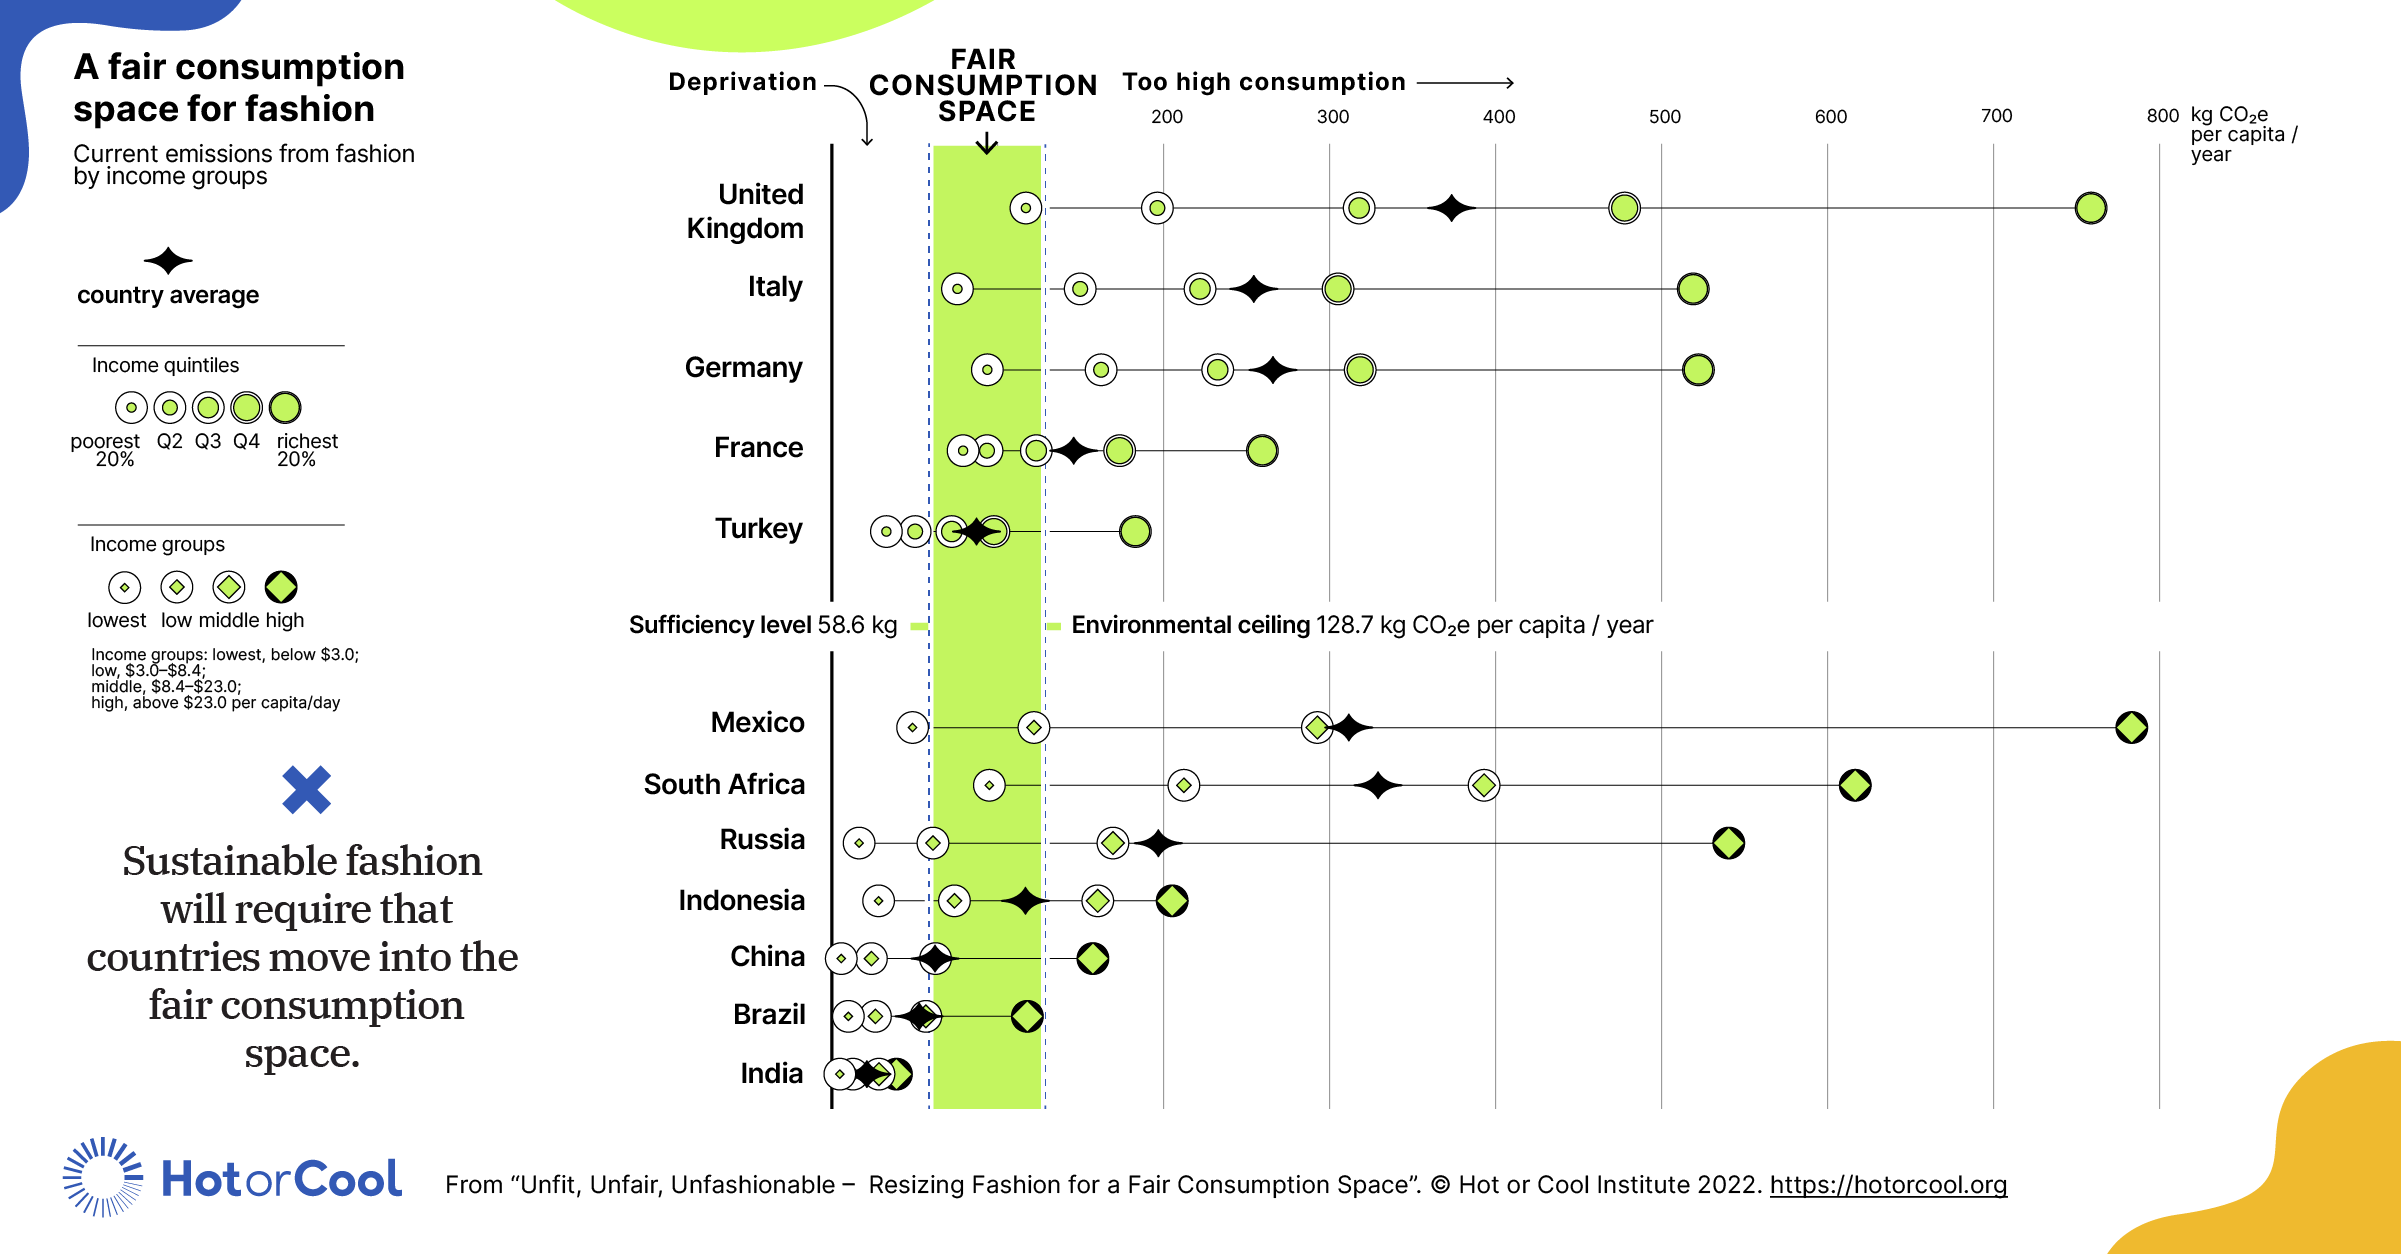
A fair consumption space for fashion. How much different countries and income groups within them will need to reduce their fashion-related emissions. United Kingdom is highest while India is below sufficiency levels.

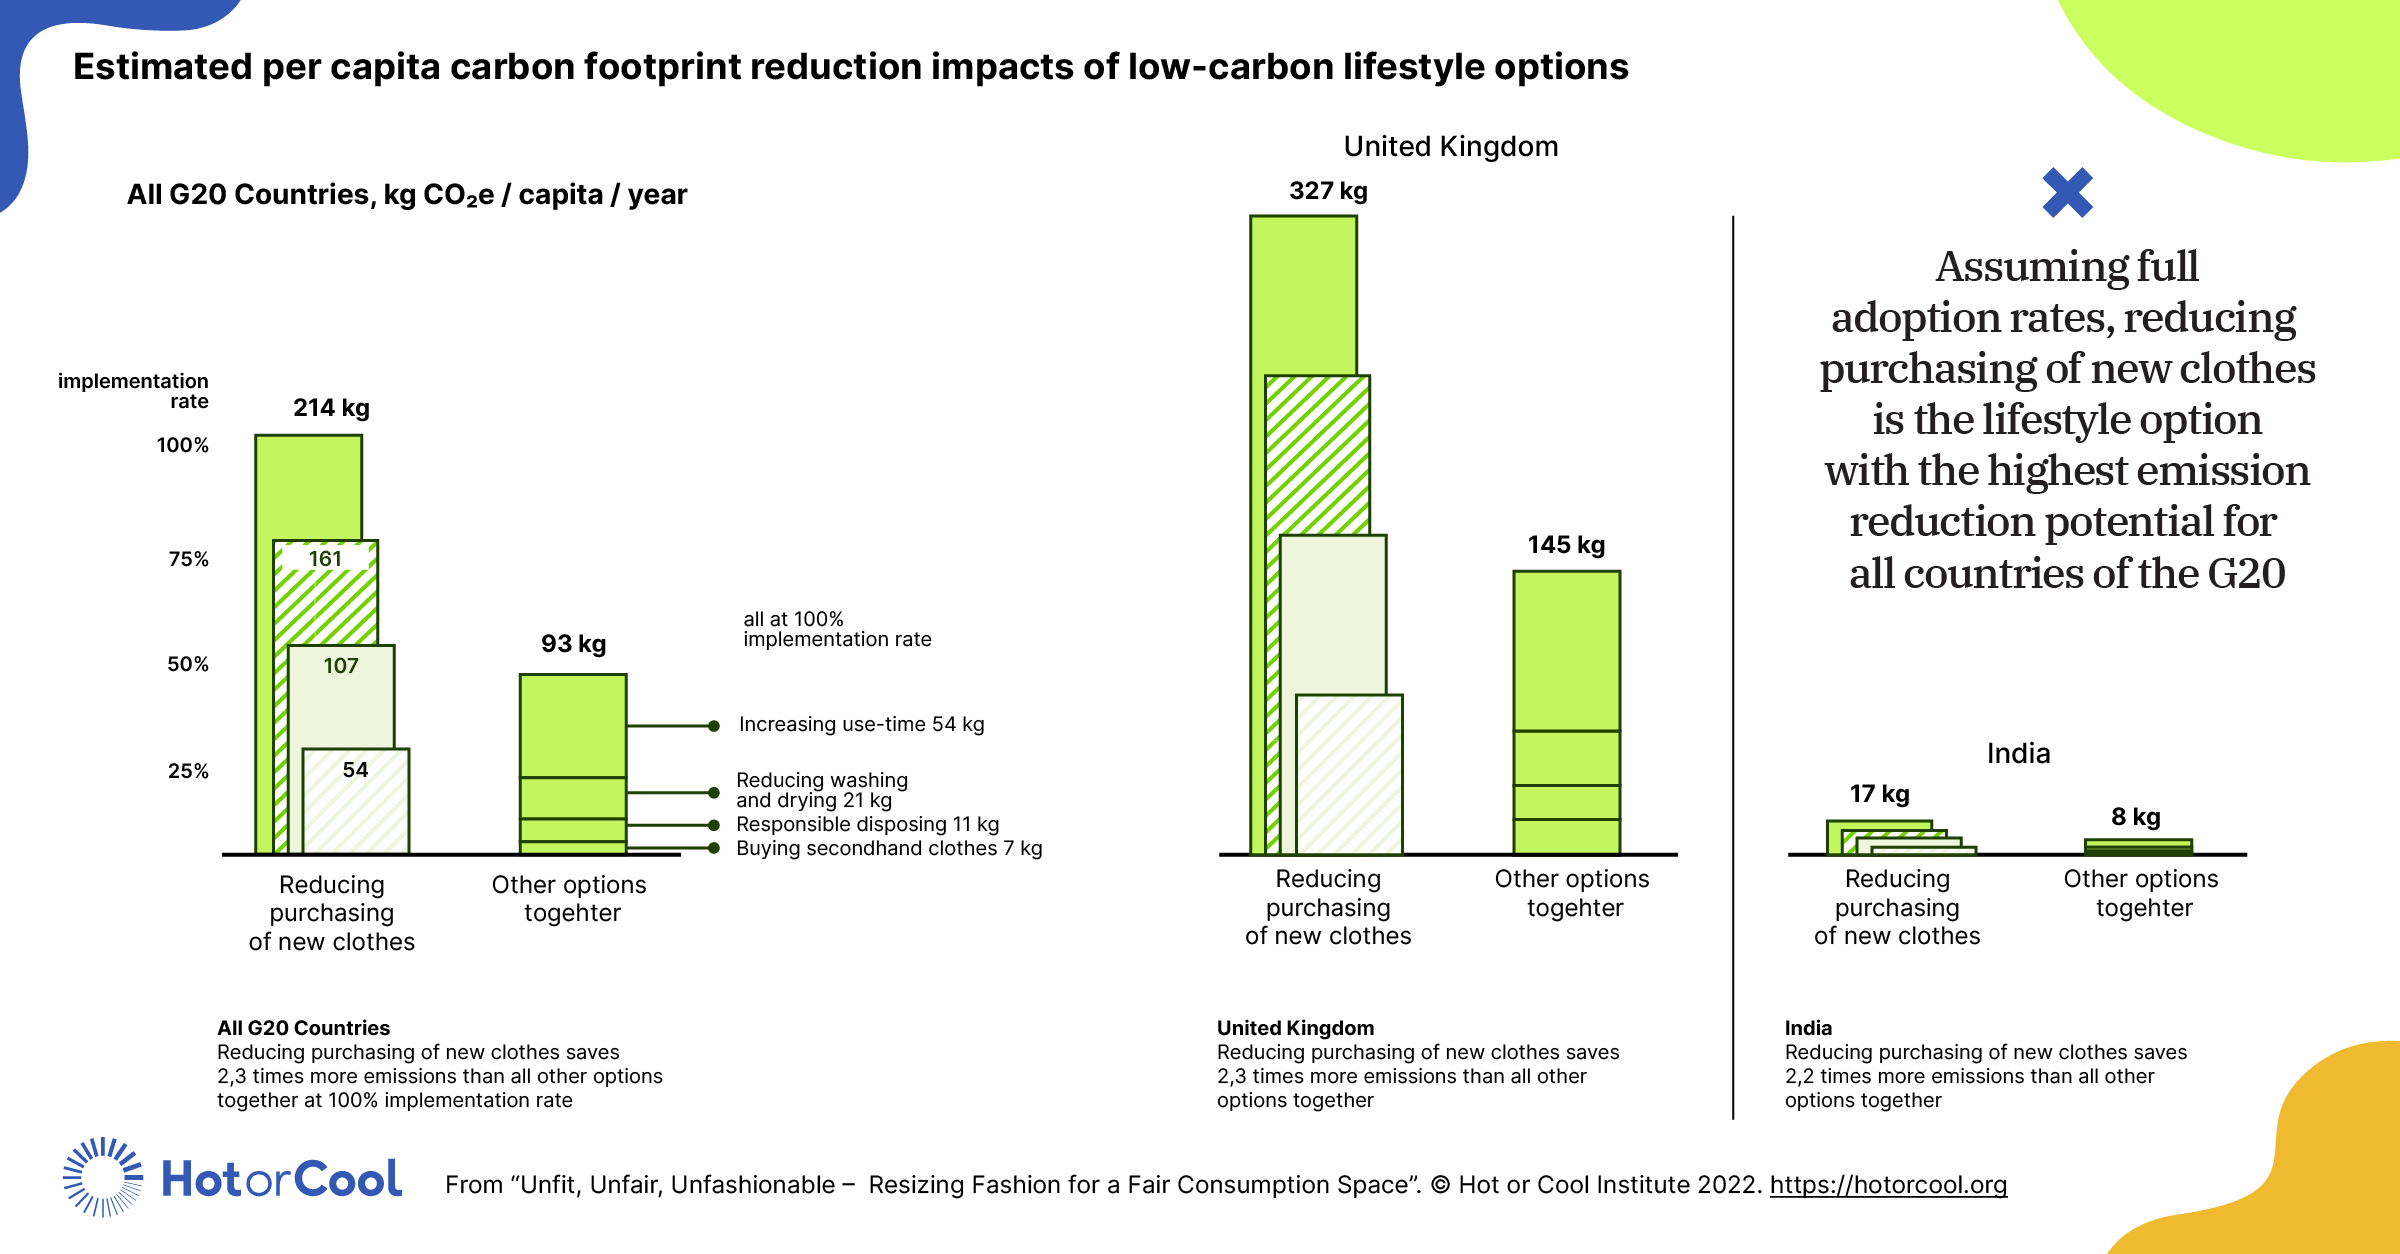
Chart showing impact of different measures on carbon footprints for G20 countries, UK and India. Reducing purchase of new clothes has larger impact than all other options together.

Download the full report: https://hotorcool.org/unfit-unfair-unfashionable/


IPCC infographics for the Ministry of Environment & FMI

Selected graphics depicting the main findings of IPCC’s Special Report on Global Warming of 1.5°C, the Special Report on the Ocean and Cryosphere and the 6th Assessment Report.

Contributor: Tero Juuti (animator)

All graphics available at: https://www.ilmasto-opas.fi/etusivu
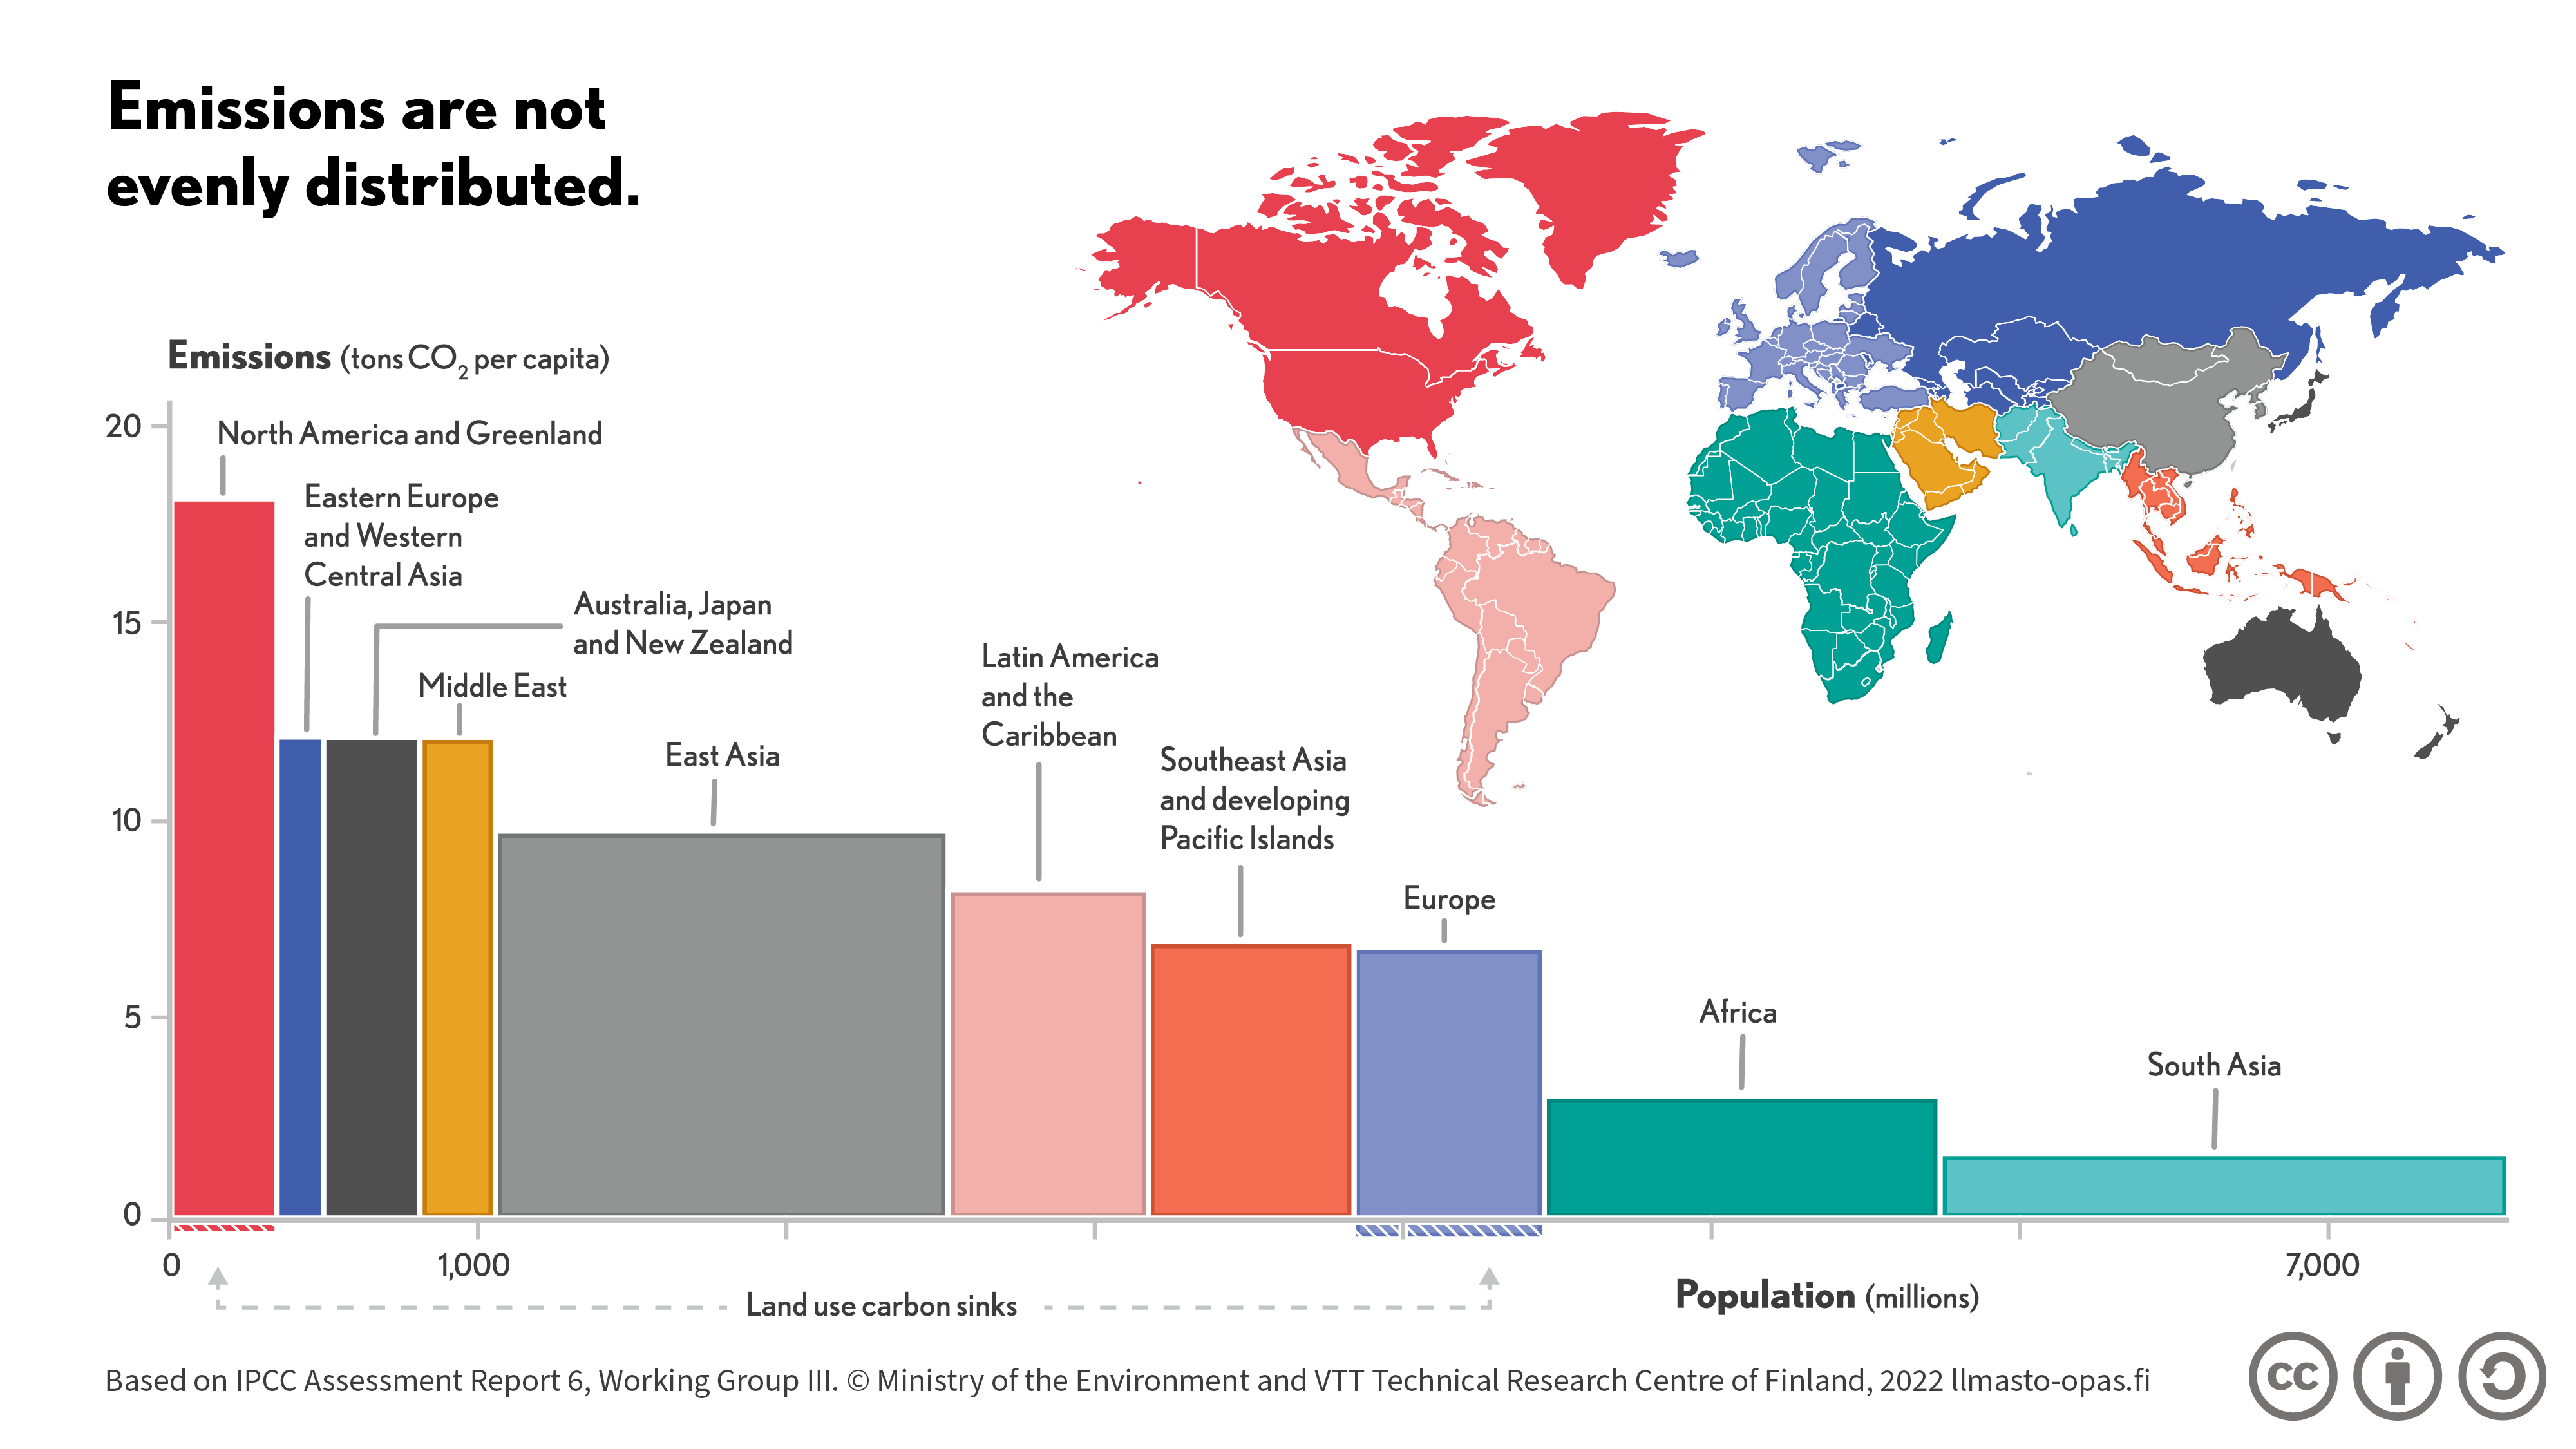
IPCC AR6 WG3 infographic of how different regions contribute to emissions. North America is highest per capita but East Asia highest total

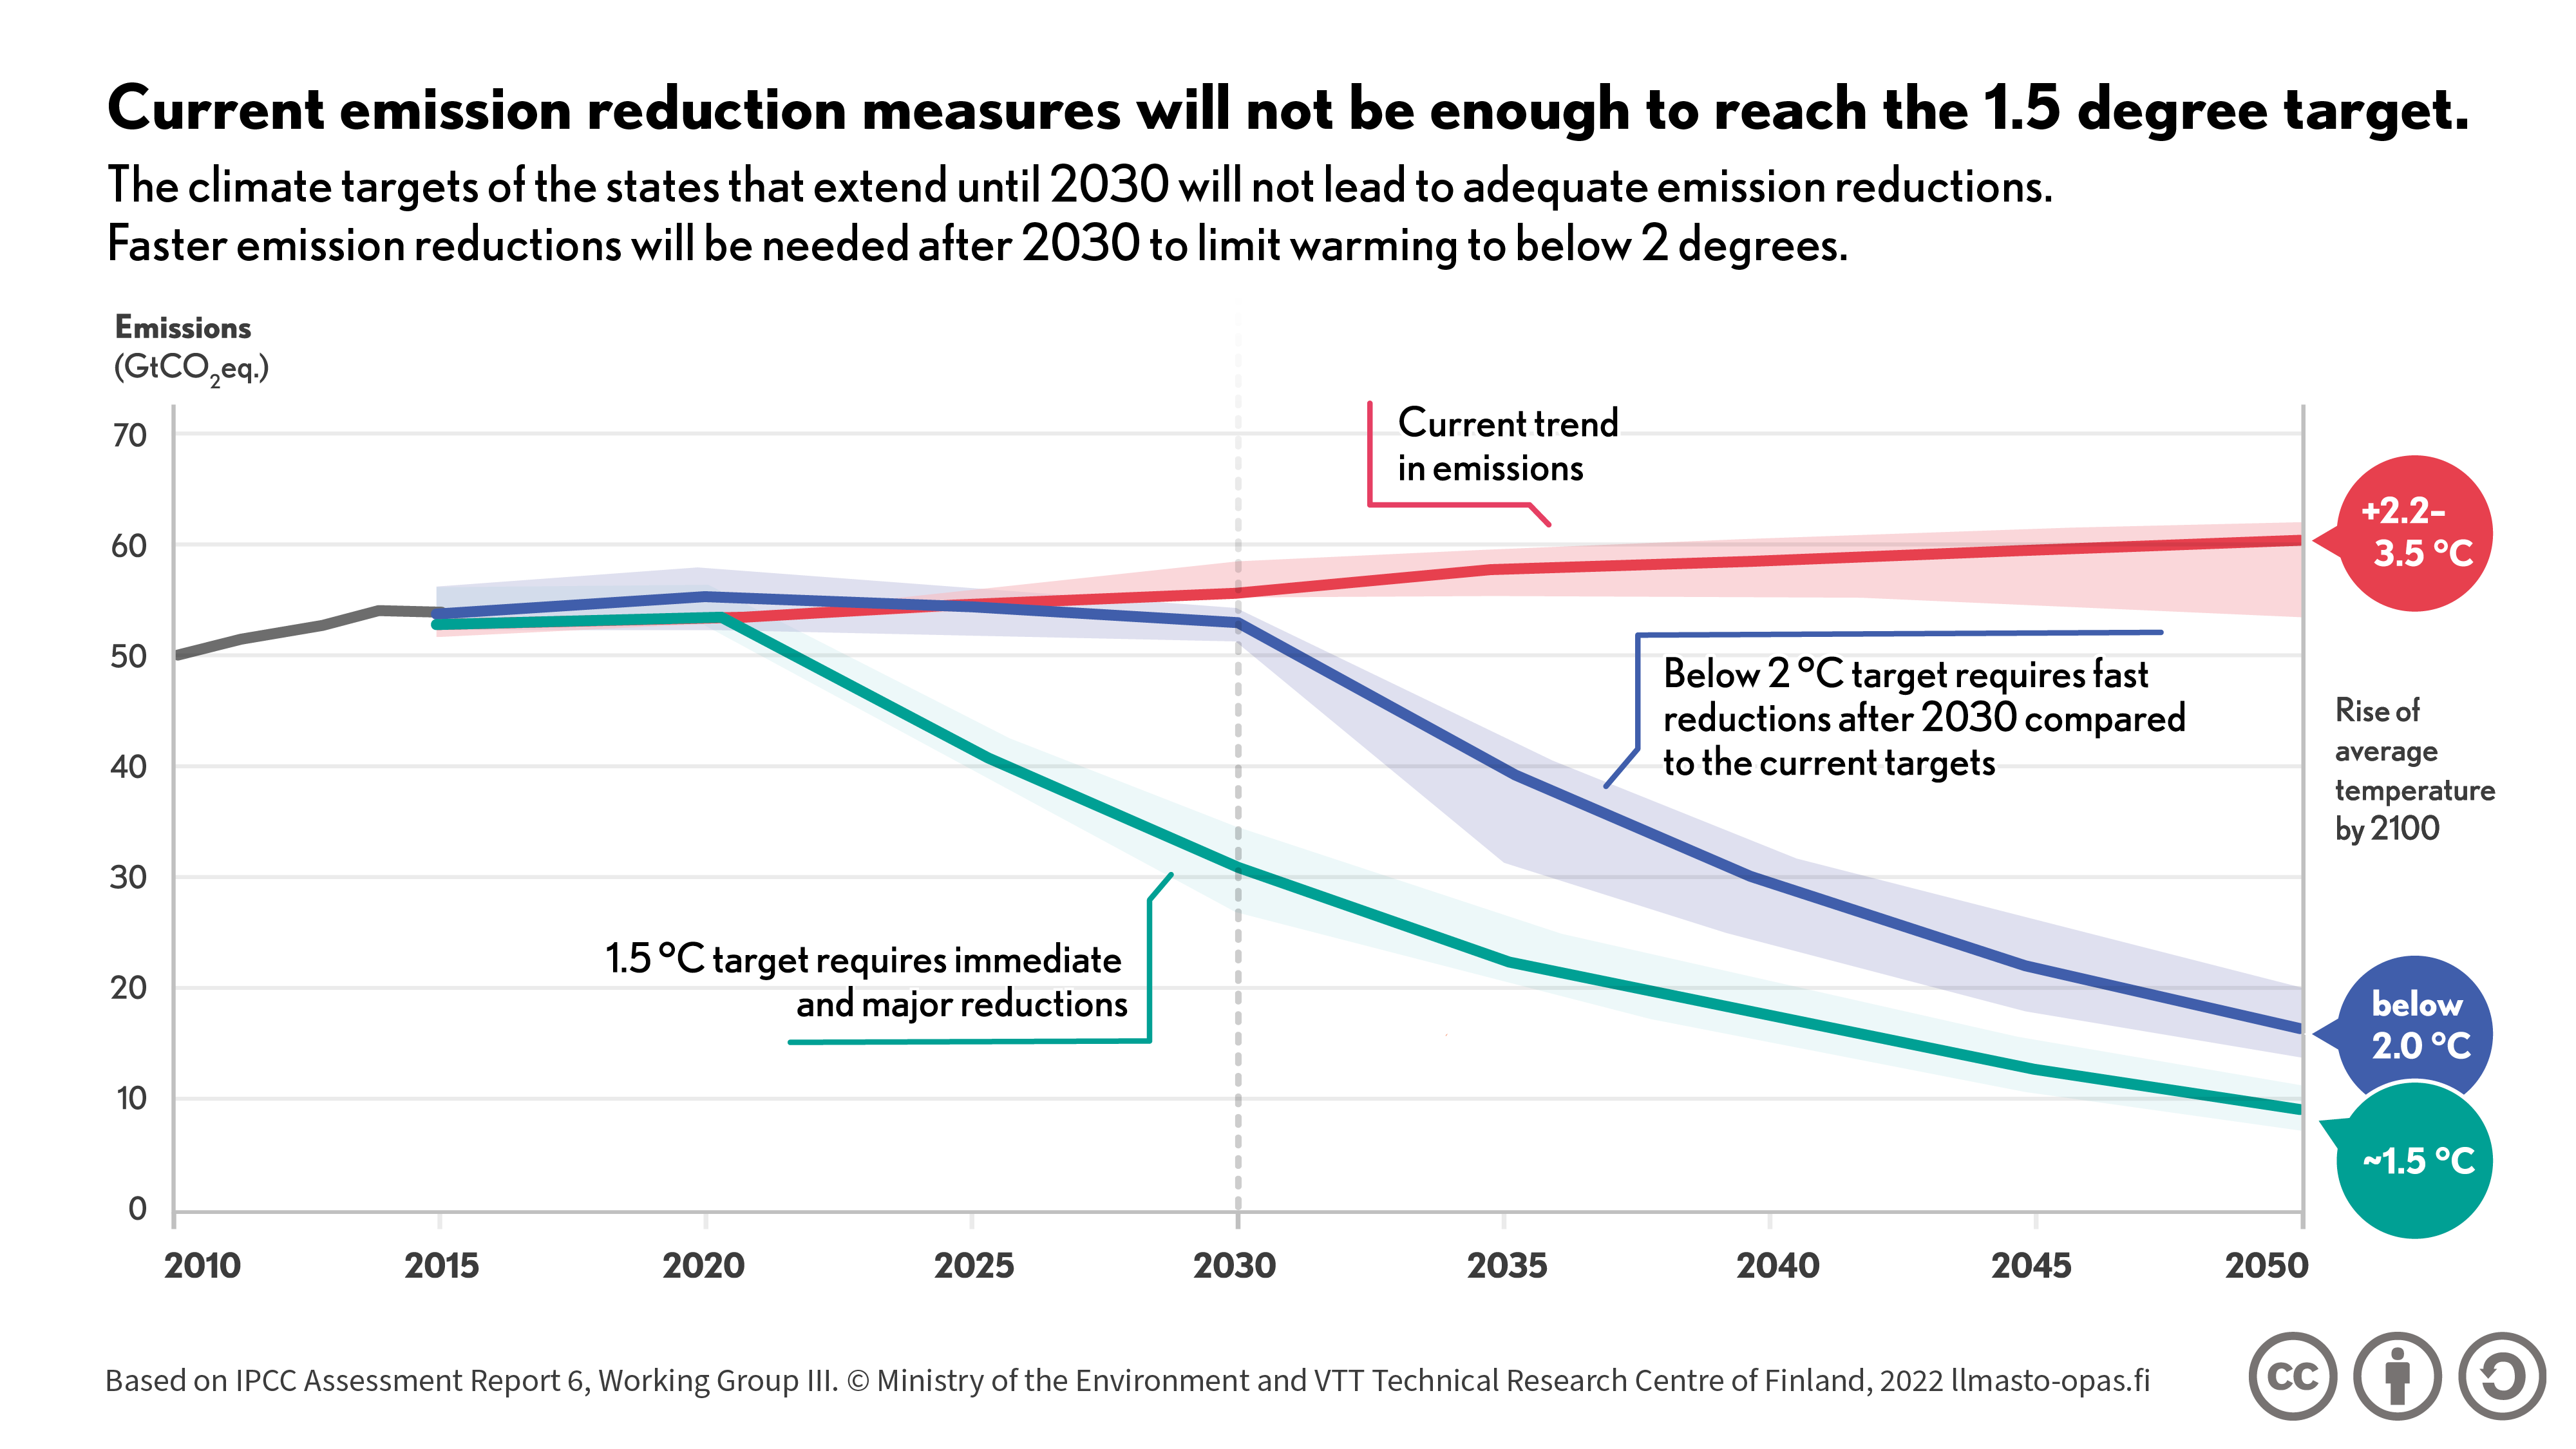
Chart showing how current trends will lead to +2.2–3.5°C increase in temperature, below 2.0°C target and ~1.5°C target

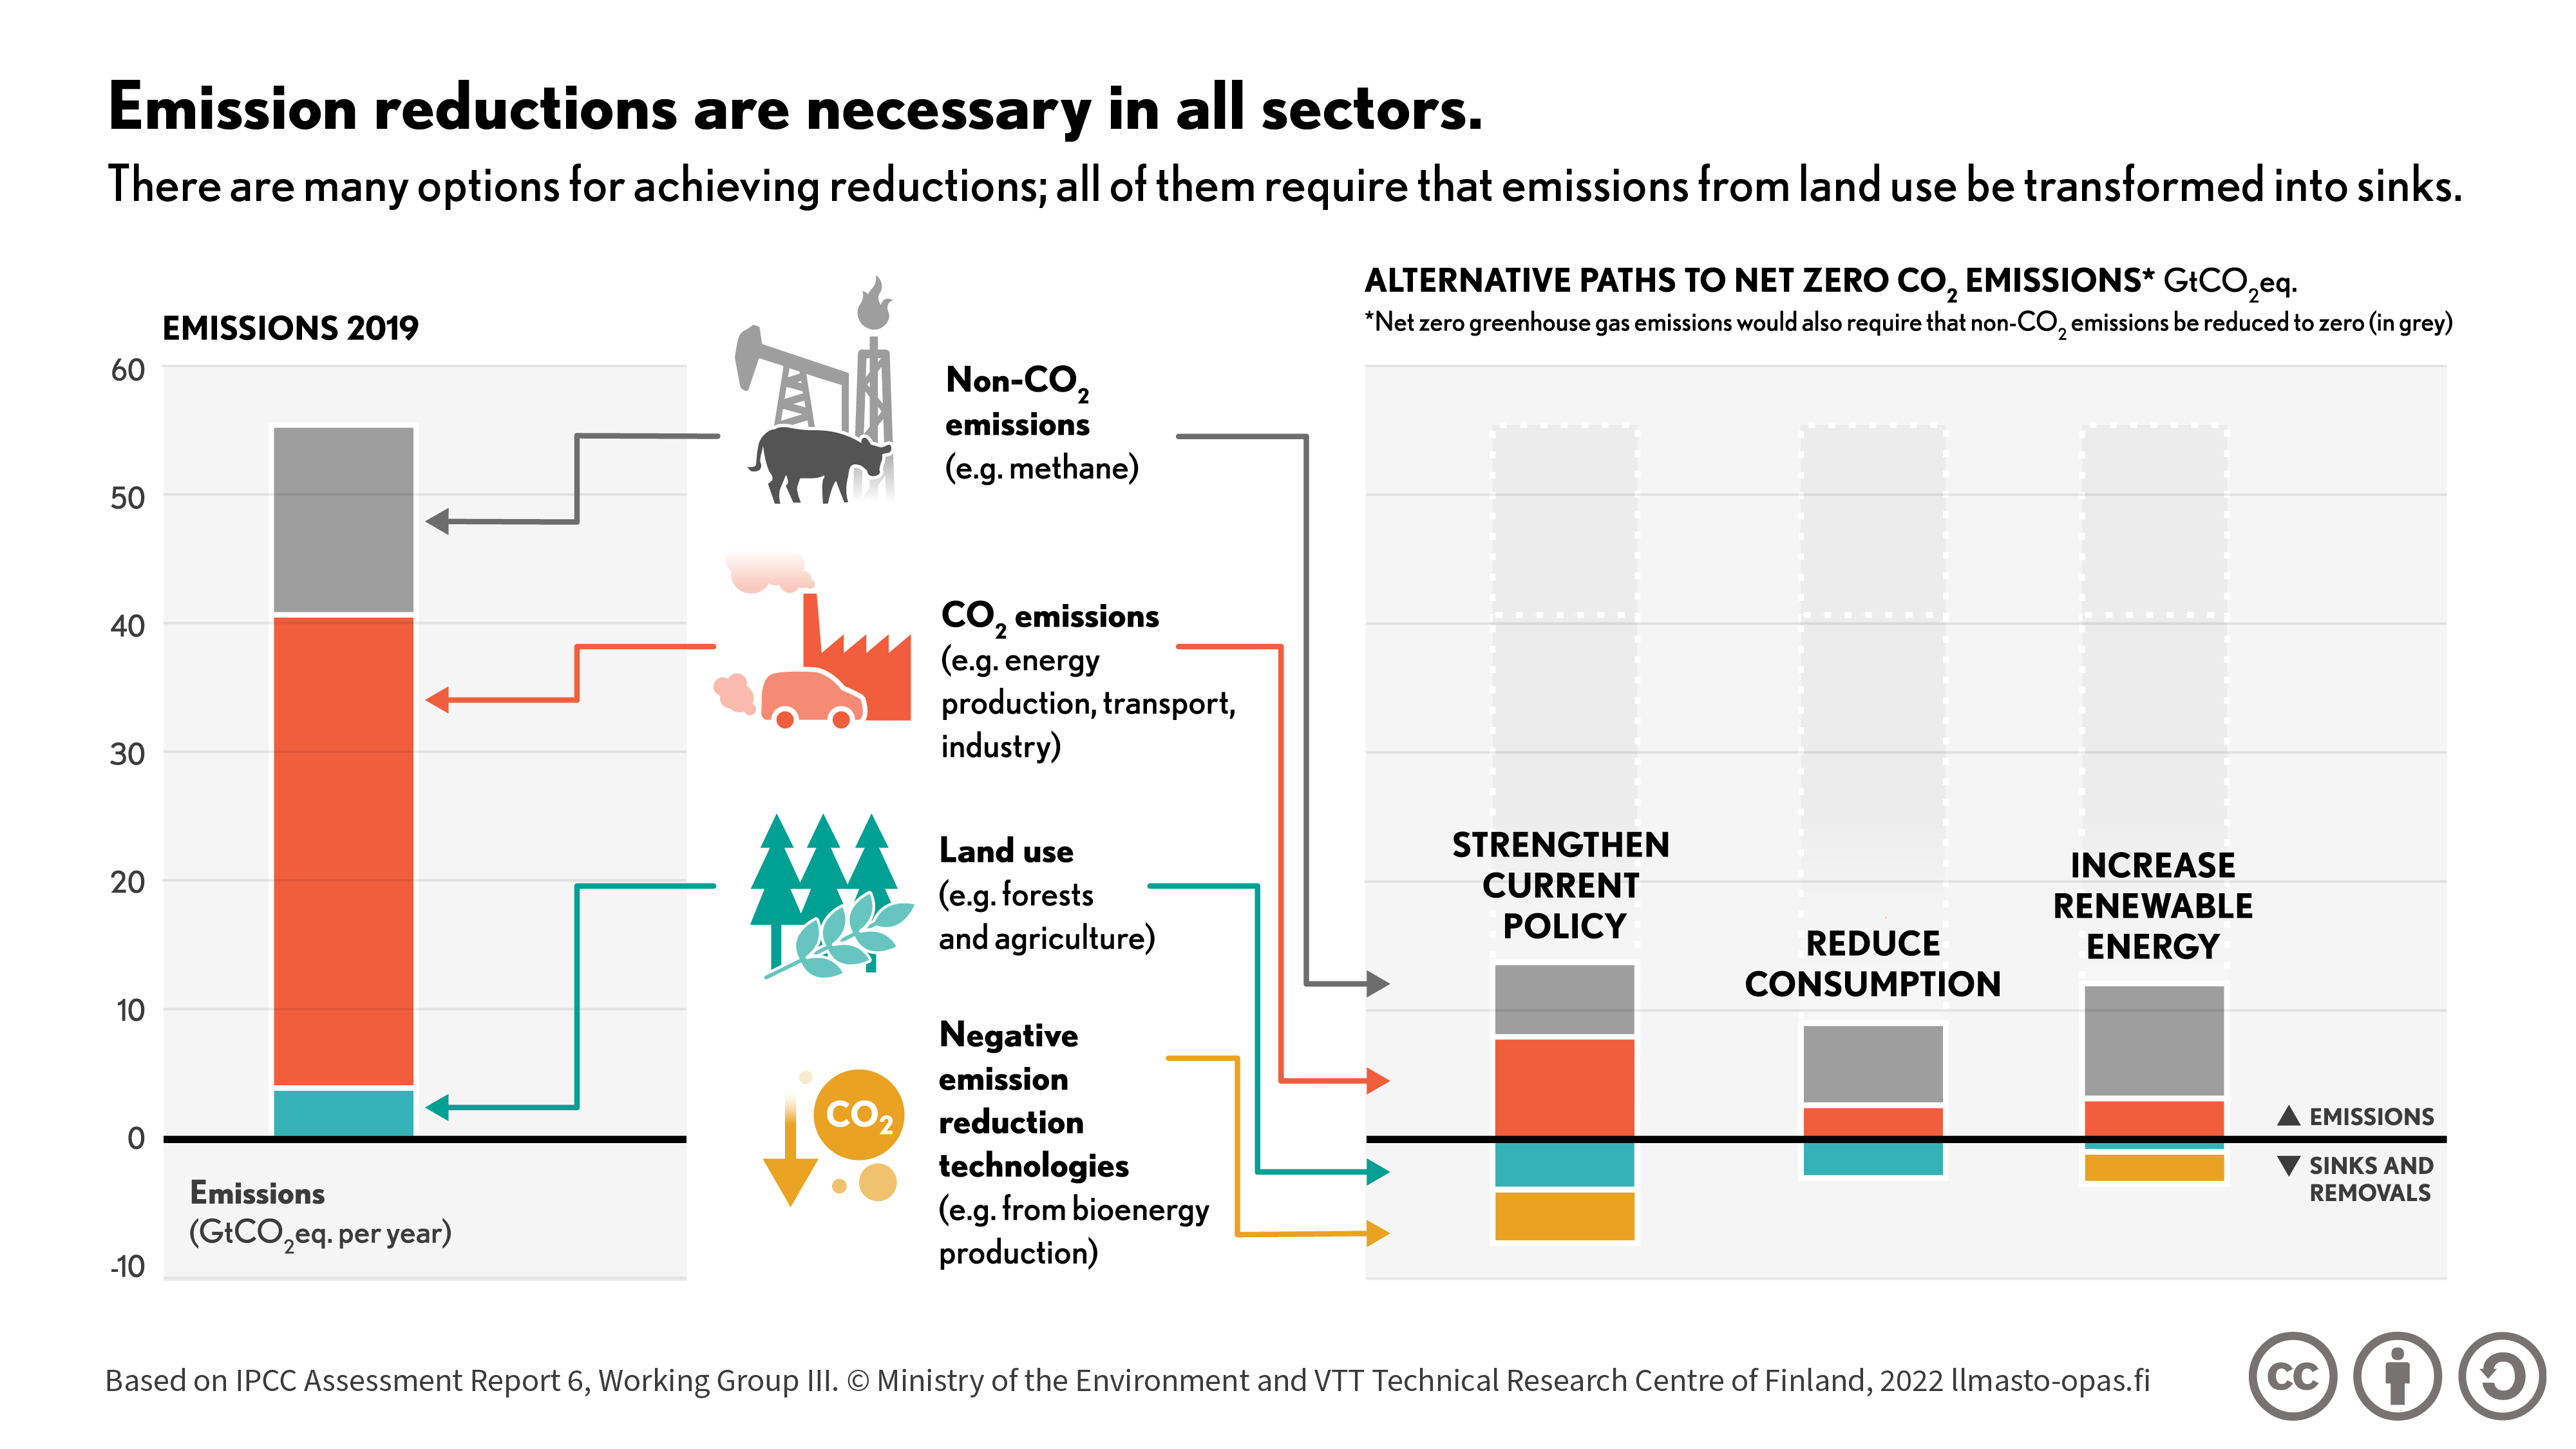
Showing the necessary emission reductions from 2019 in different sectors: non-co2, co2, land use, negative emissions technologies and three different scenarios

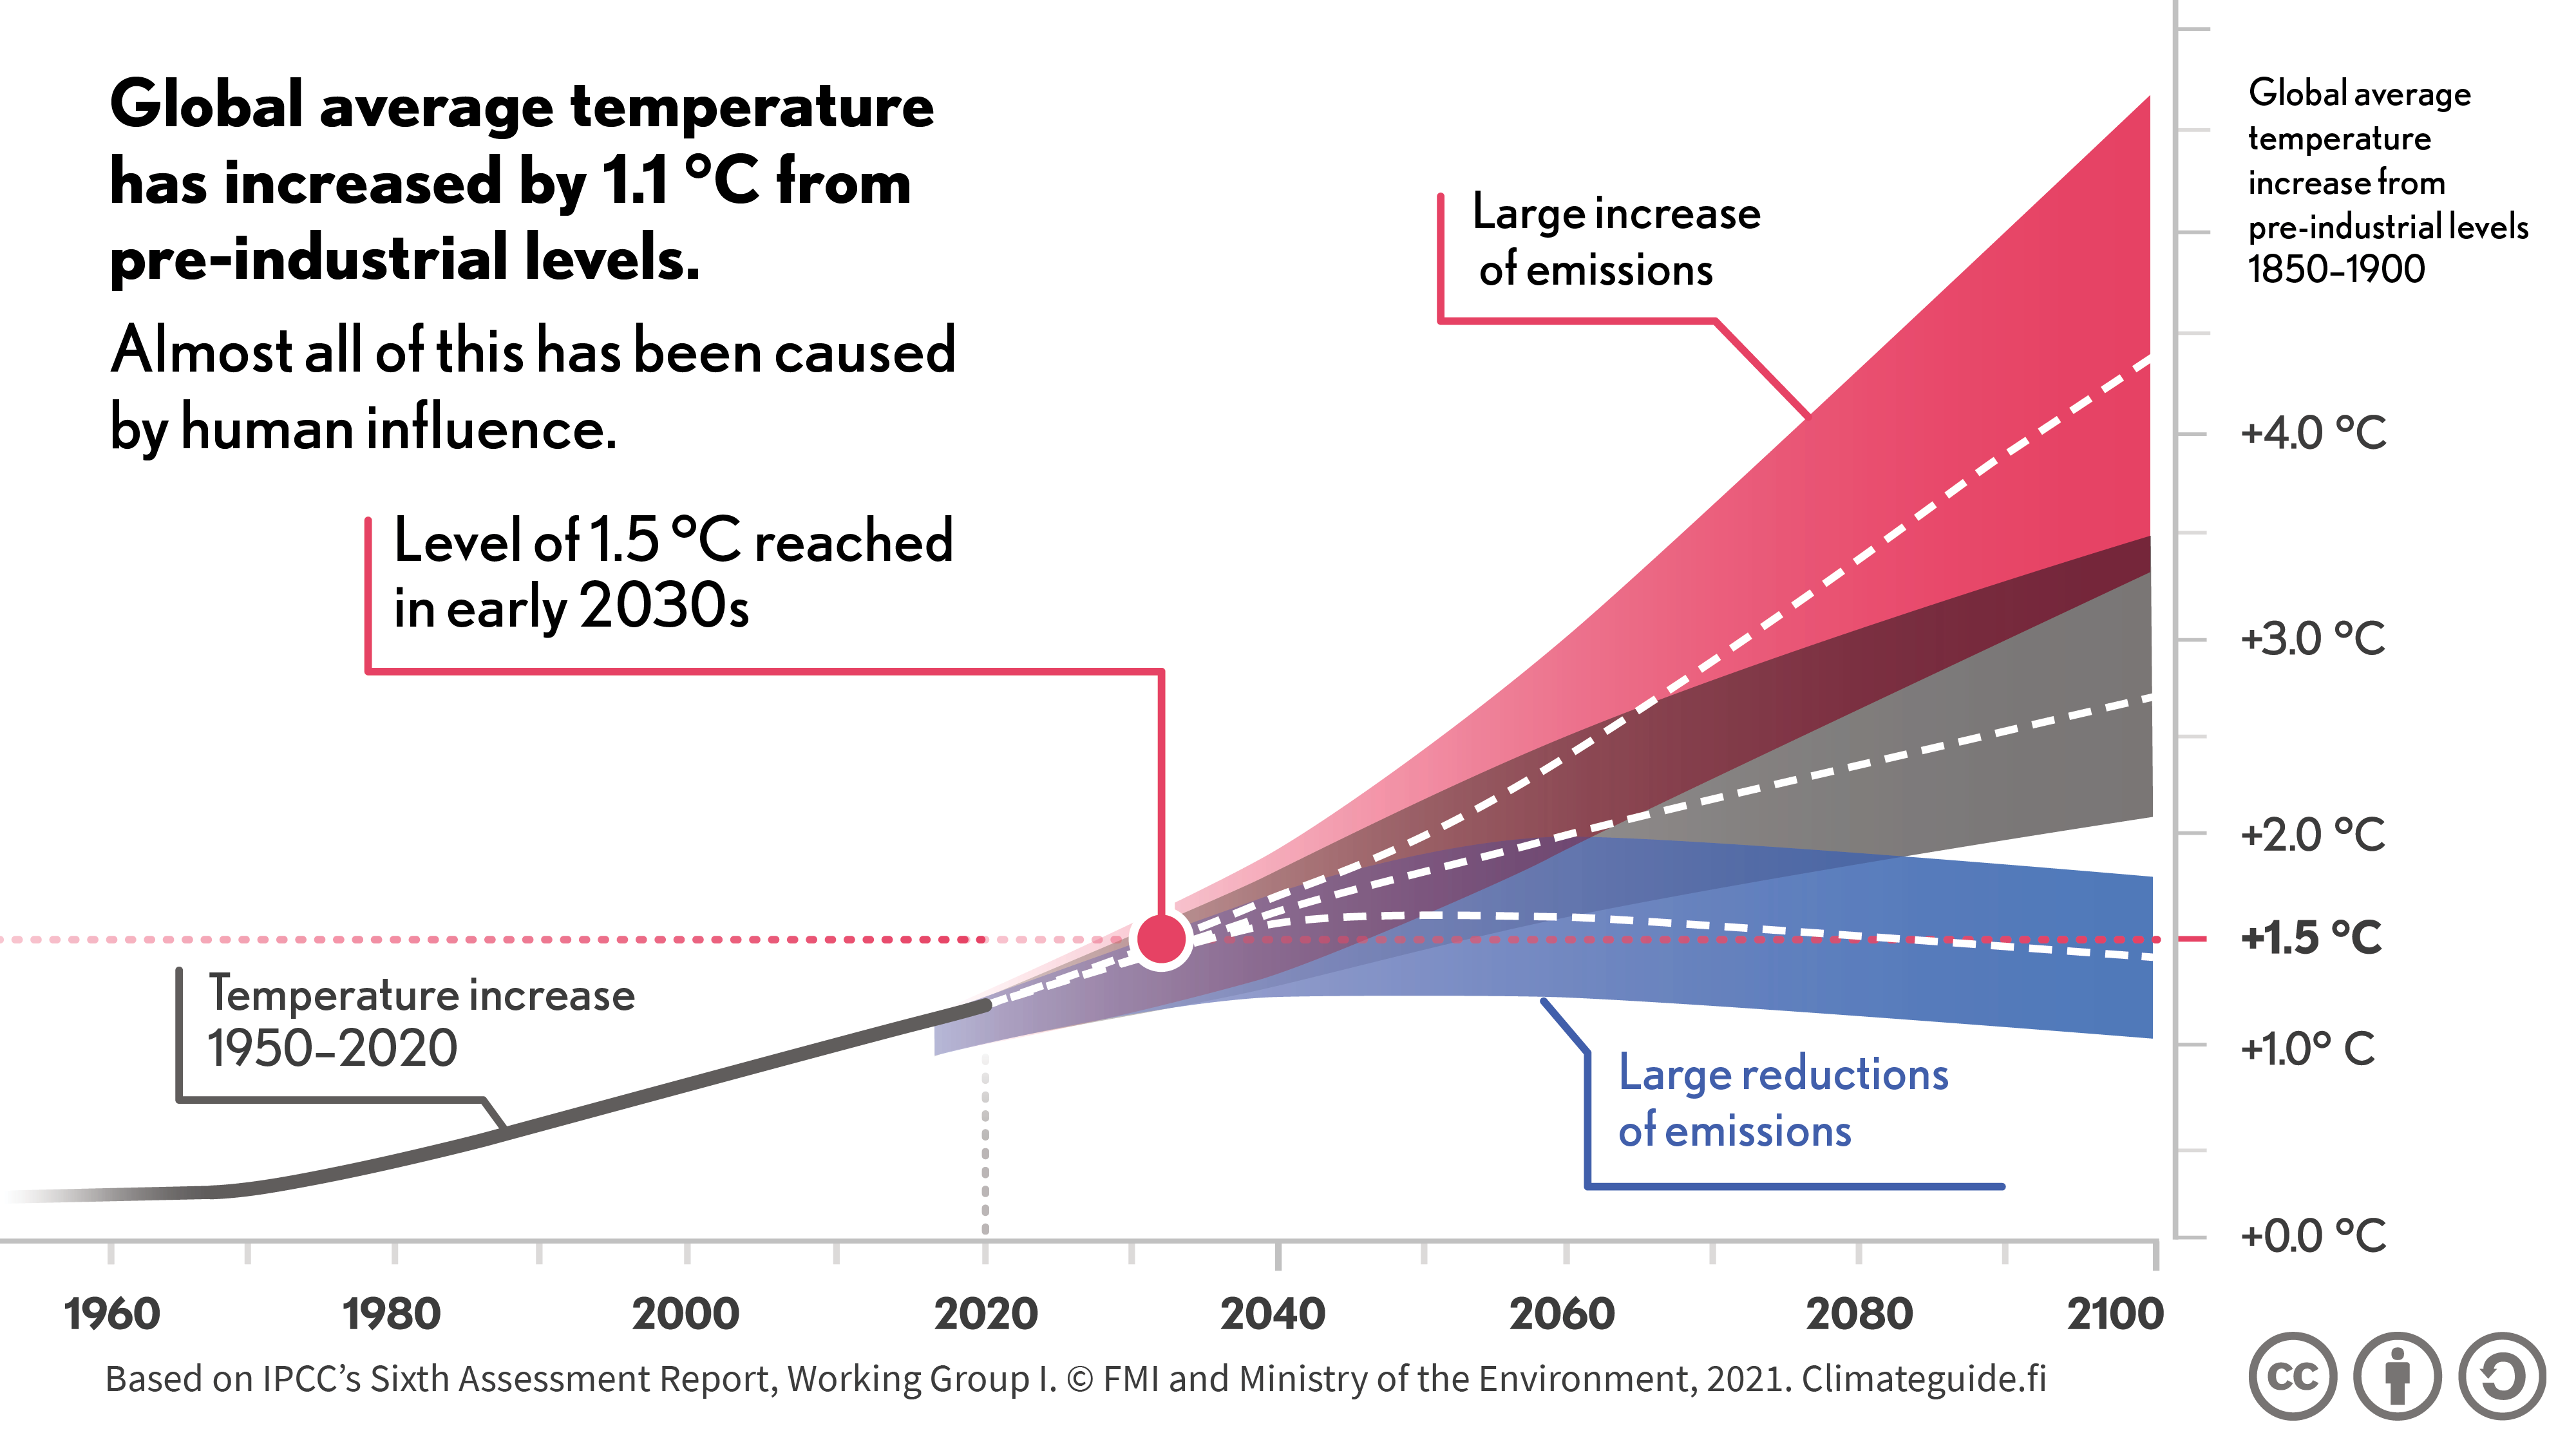
Global average temperature increase infographic from AR6, WG1

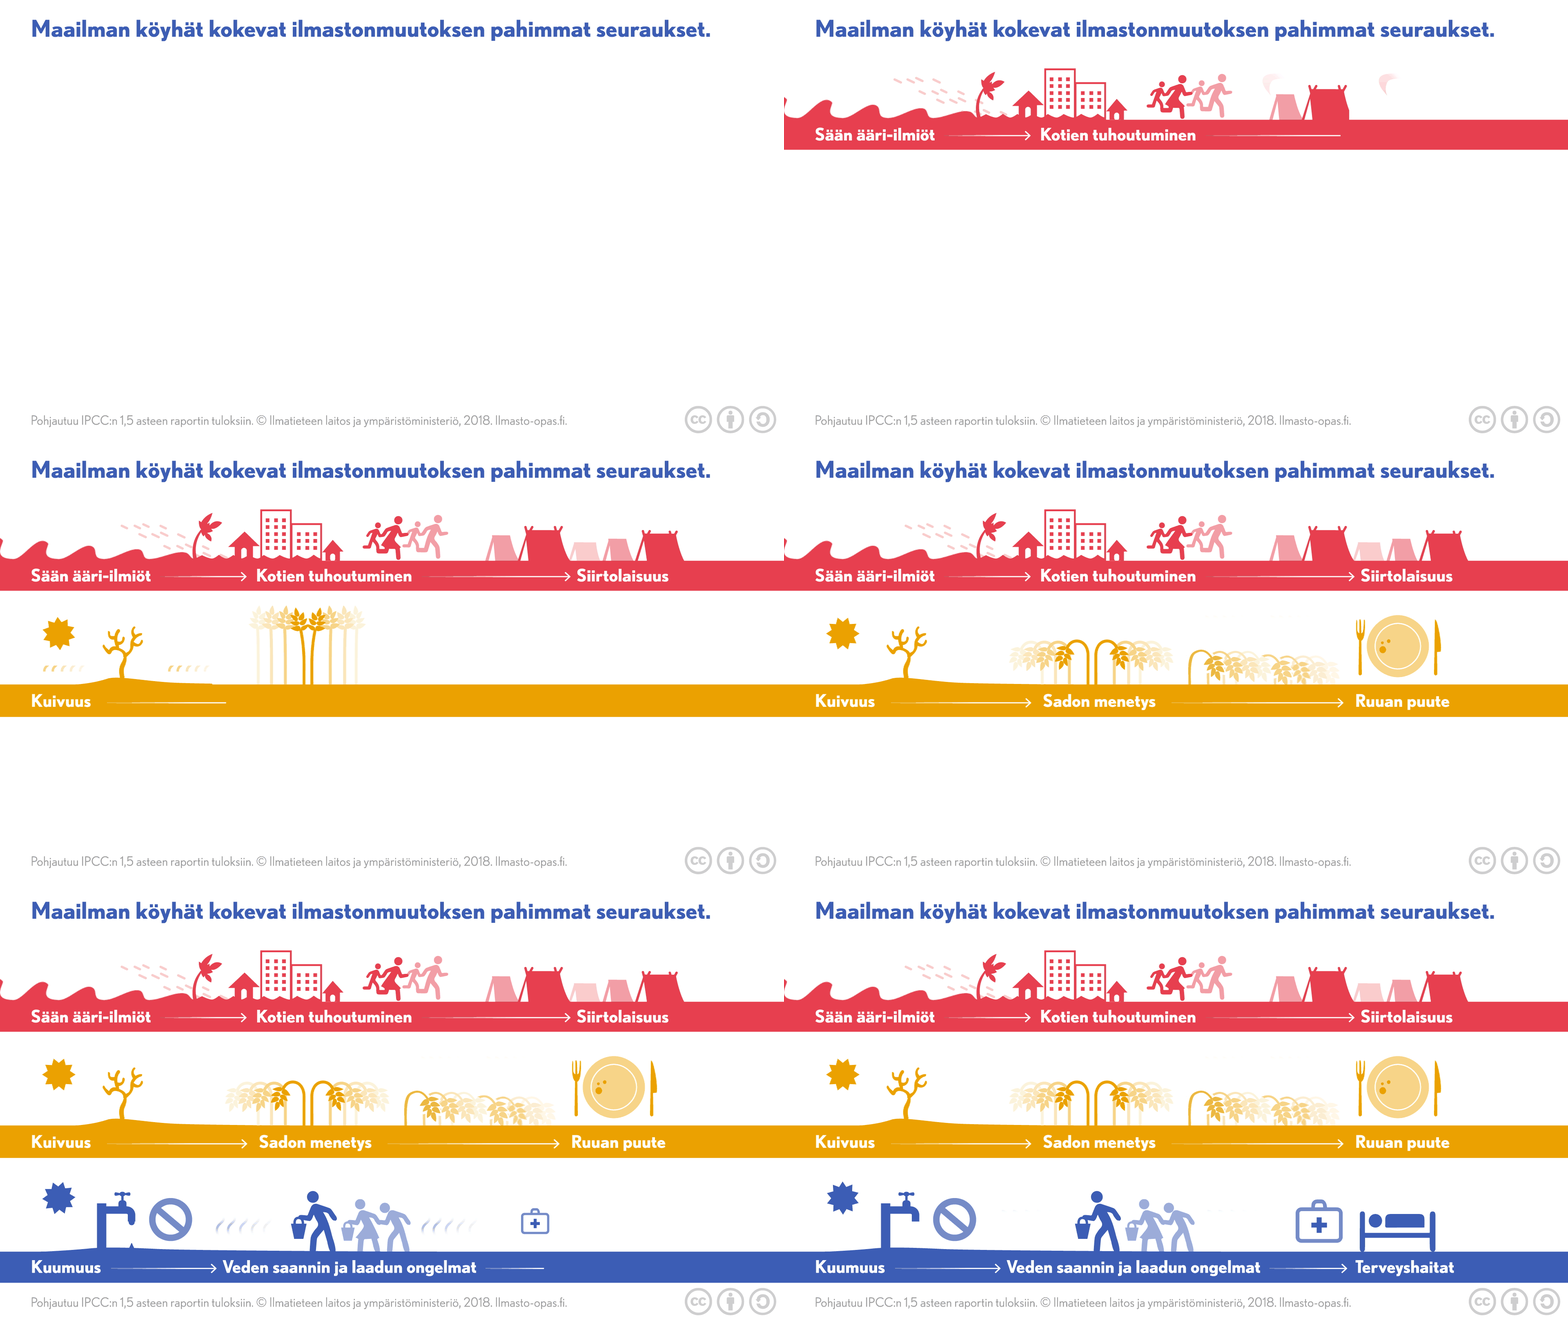
Animated infographic demonstrating the accumulated negative effects of global warming. Animated gif.

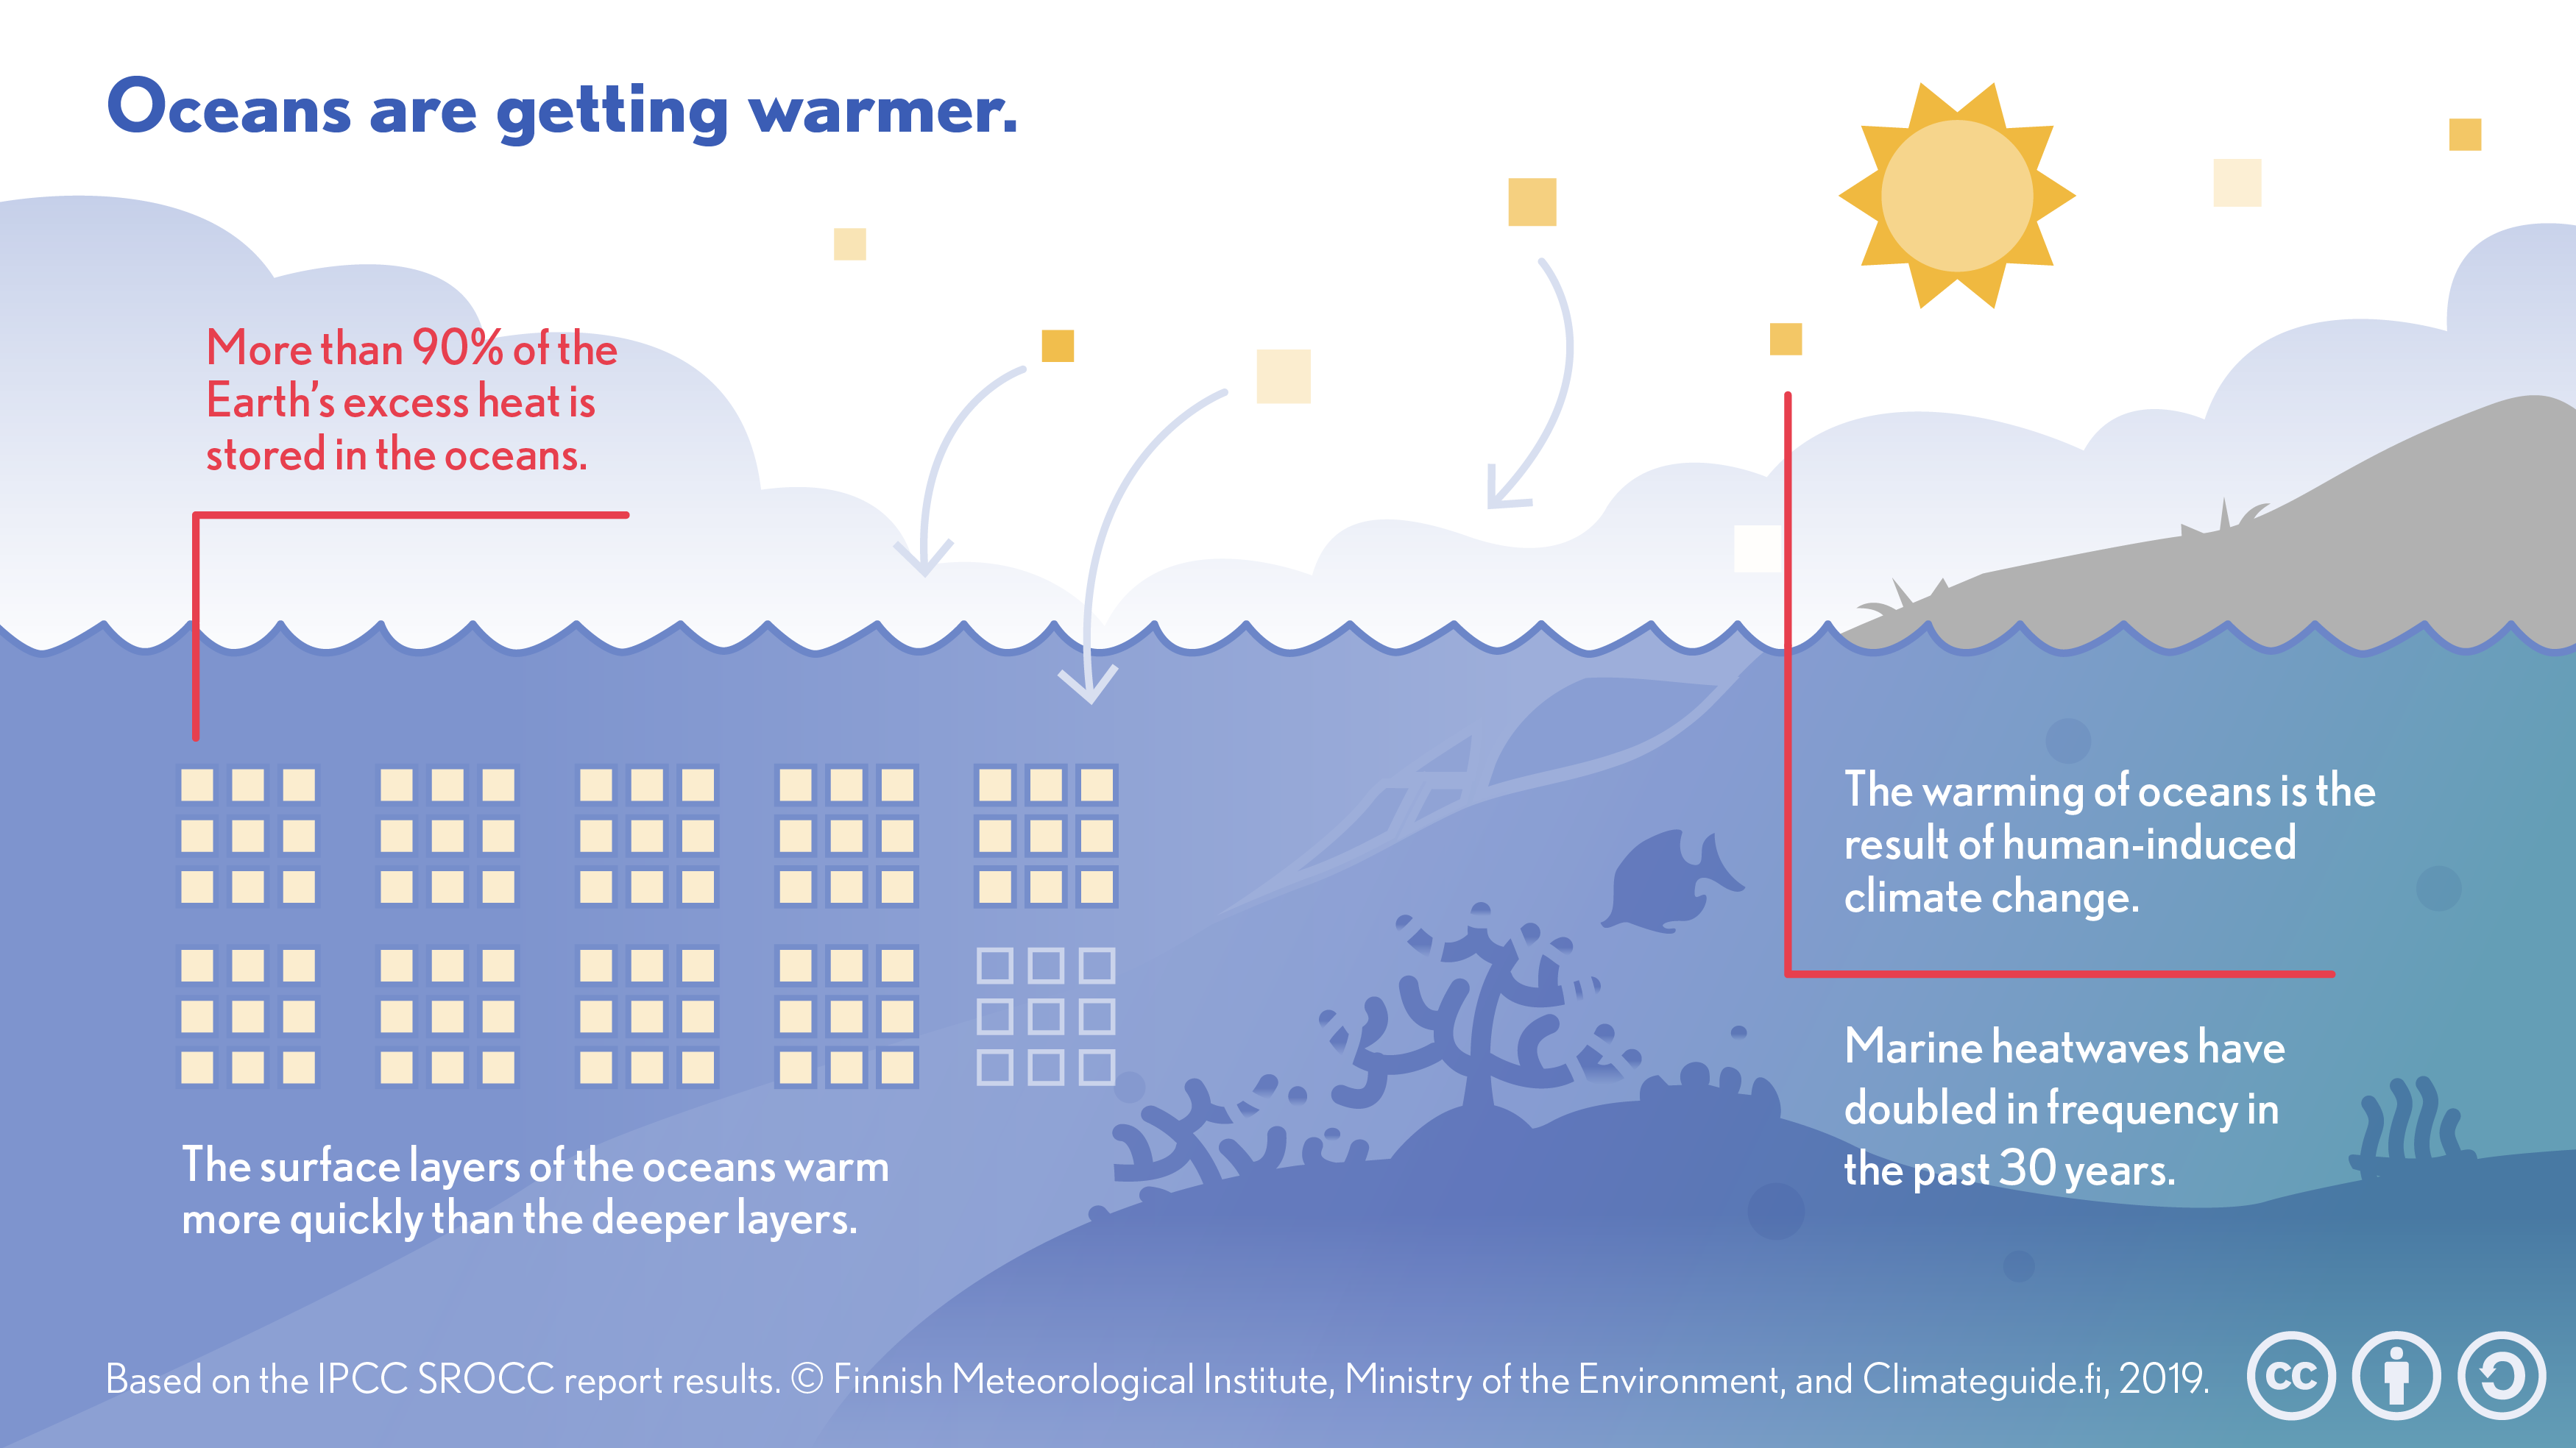
Infographic demonstrating the warming of the oceans associated with global warming. Static png image.


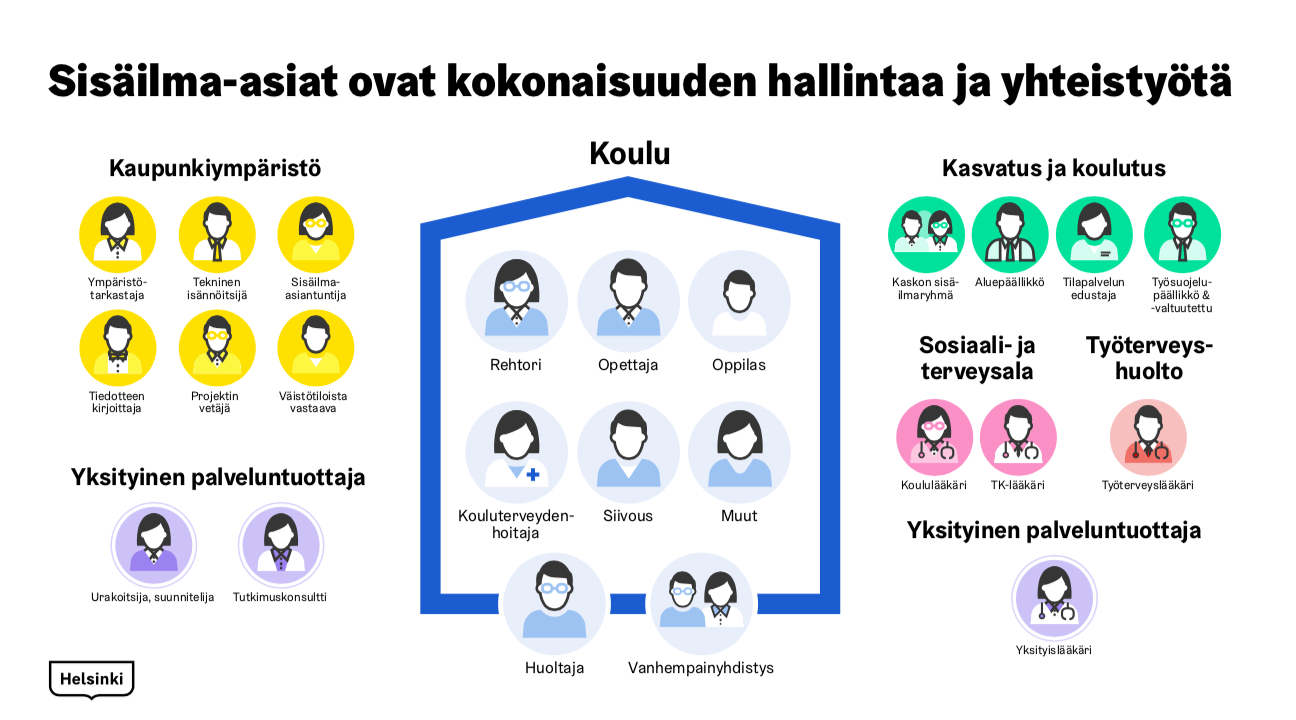
Indoor air quality graphics for City of Helsinki
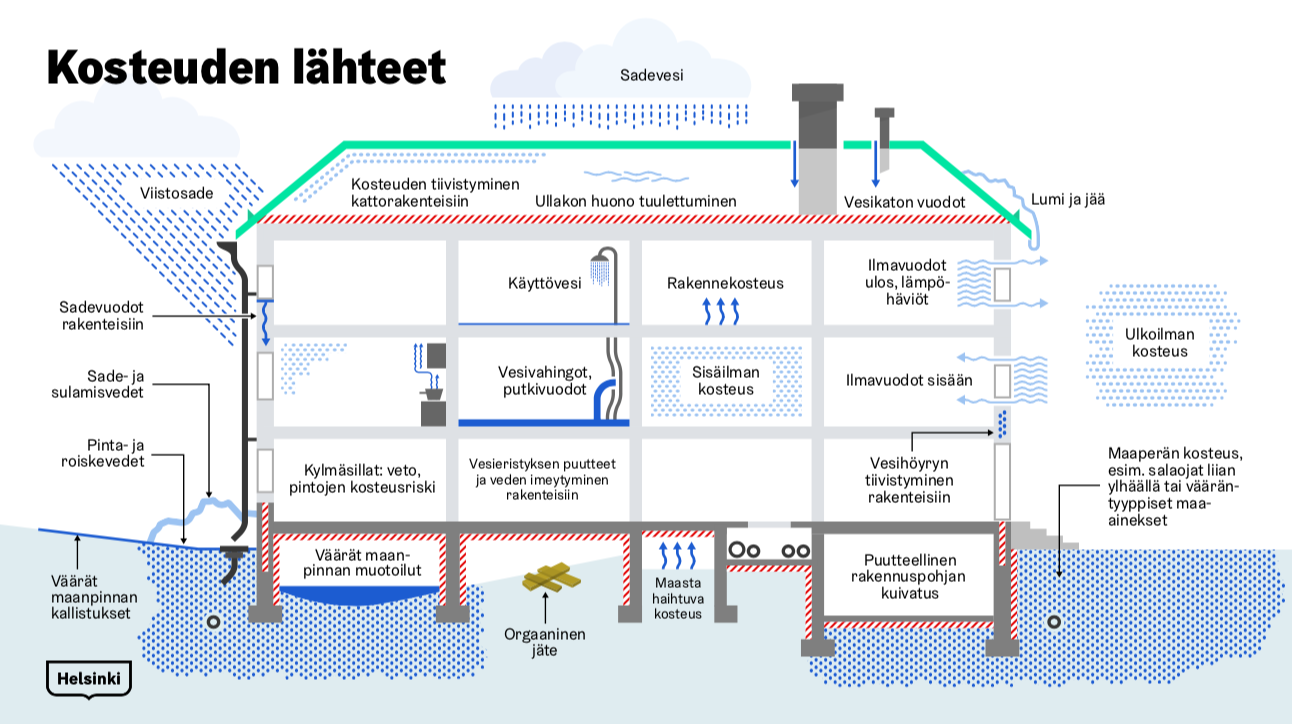
infographic. Static png image.

infographic. Static png image.


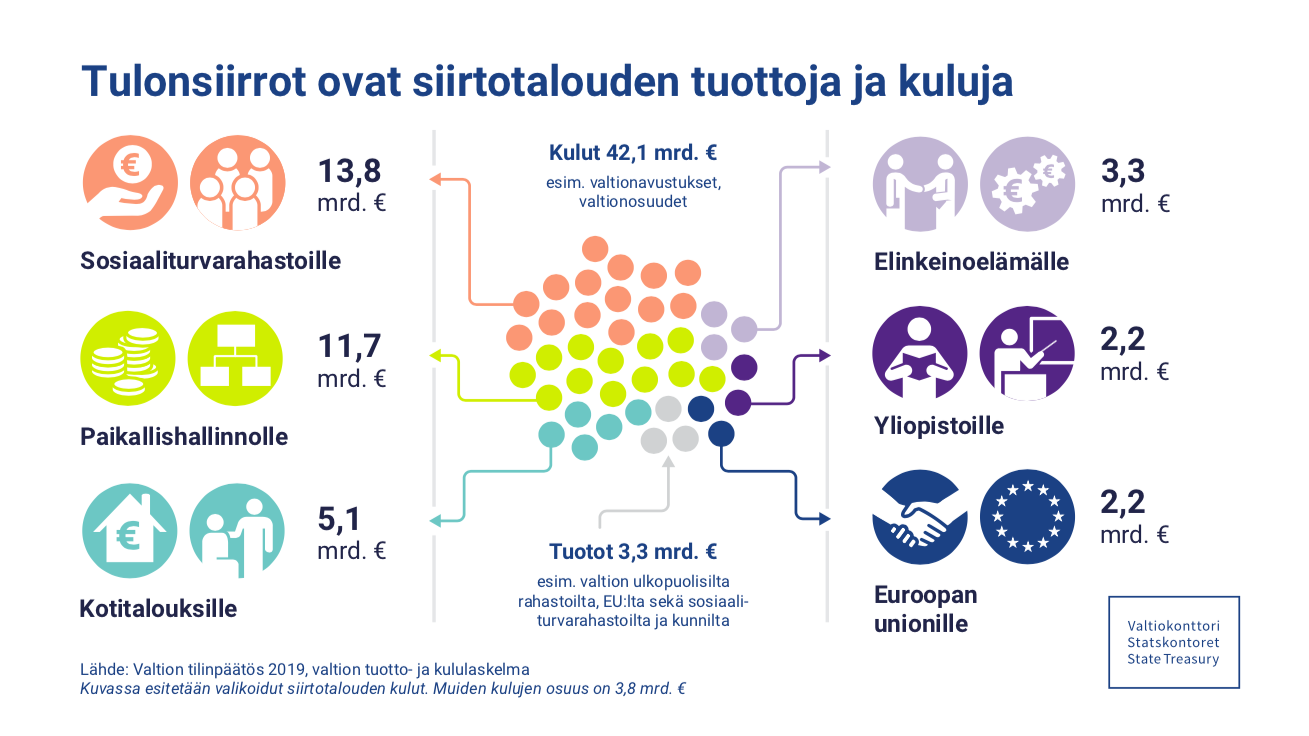
Selected infographics for the State Treasury
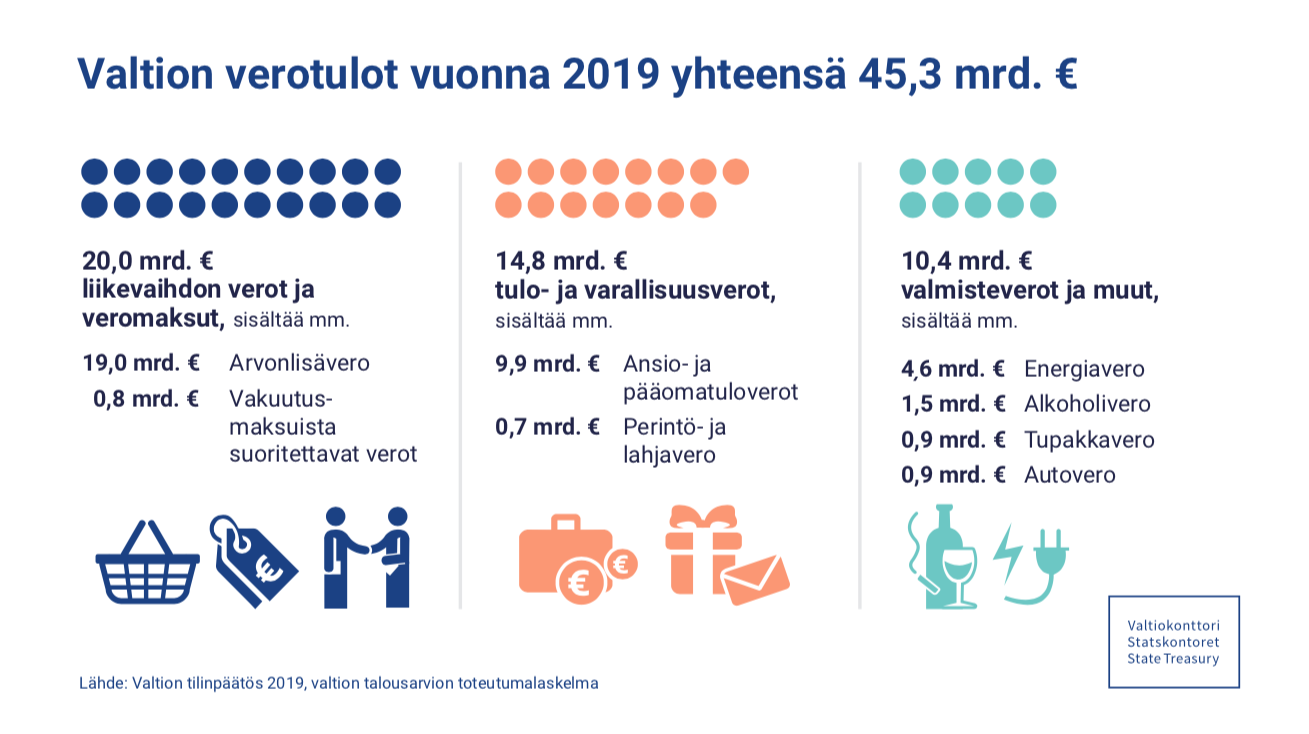
infographic. Static png image.

infographic. Static png image.


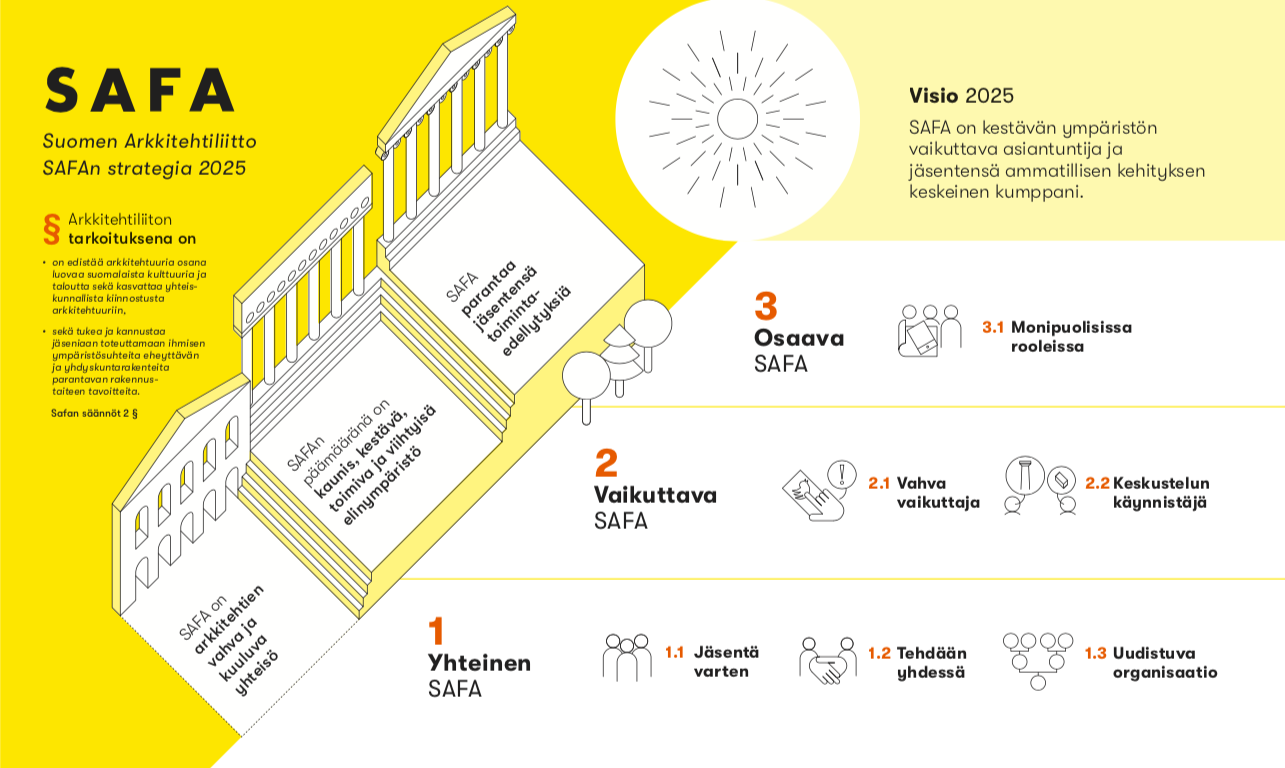
Concept graphics for SAFA, the Finnish architecture association
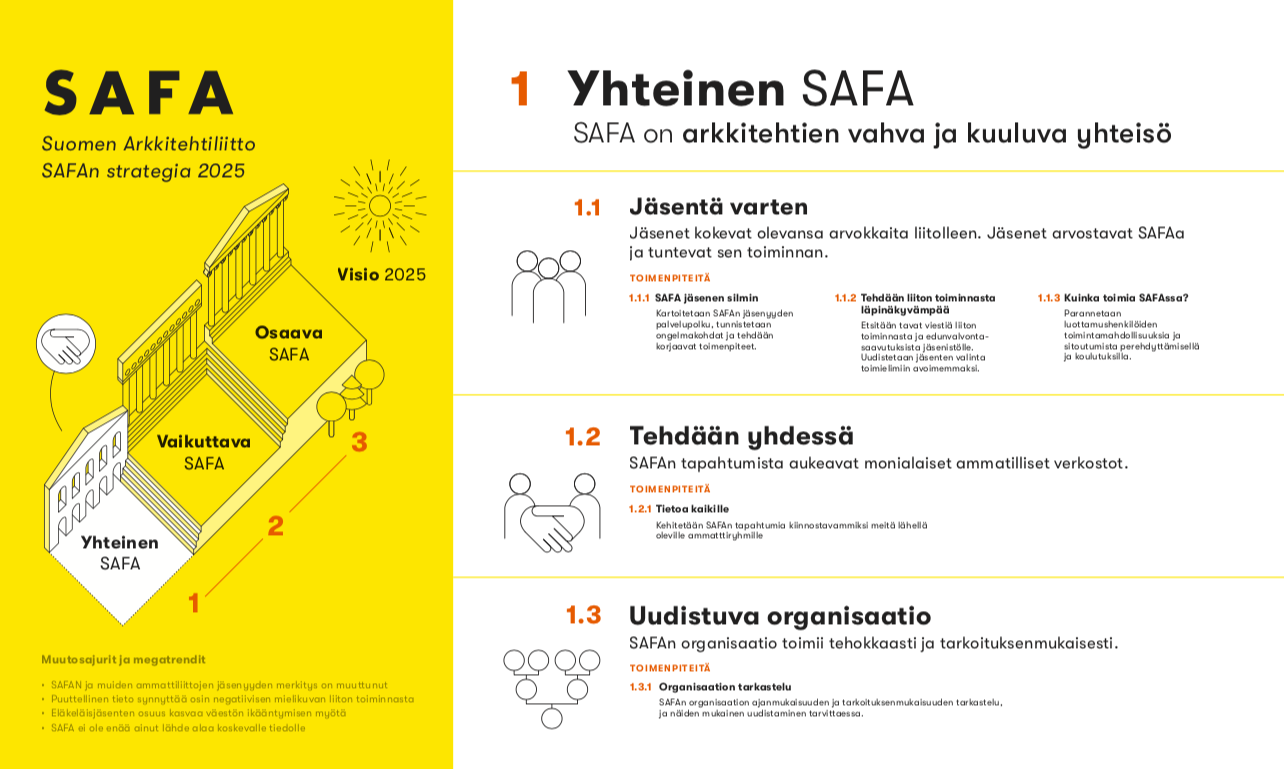
infographic. Static png image.

infographic. Static png image.


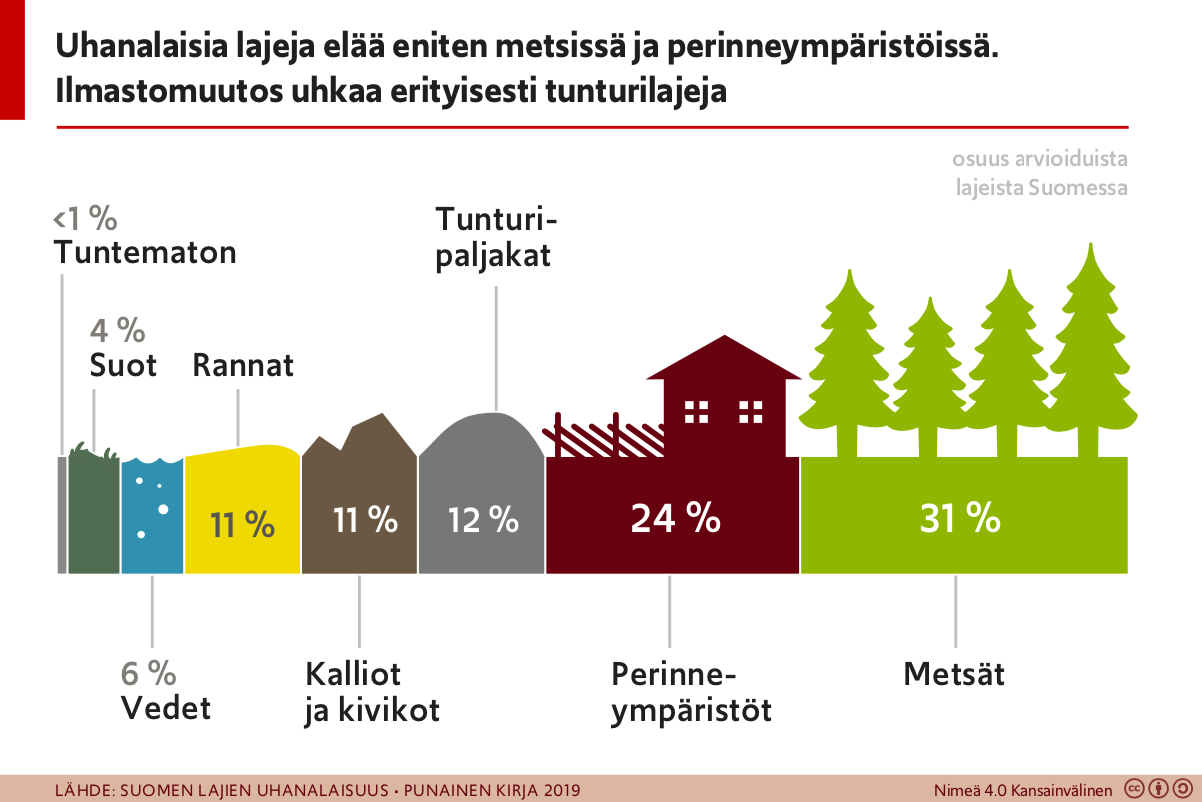
Infographics for the publication press release of the Finnish Red Book on endangered species
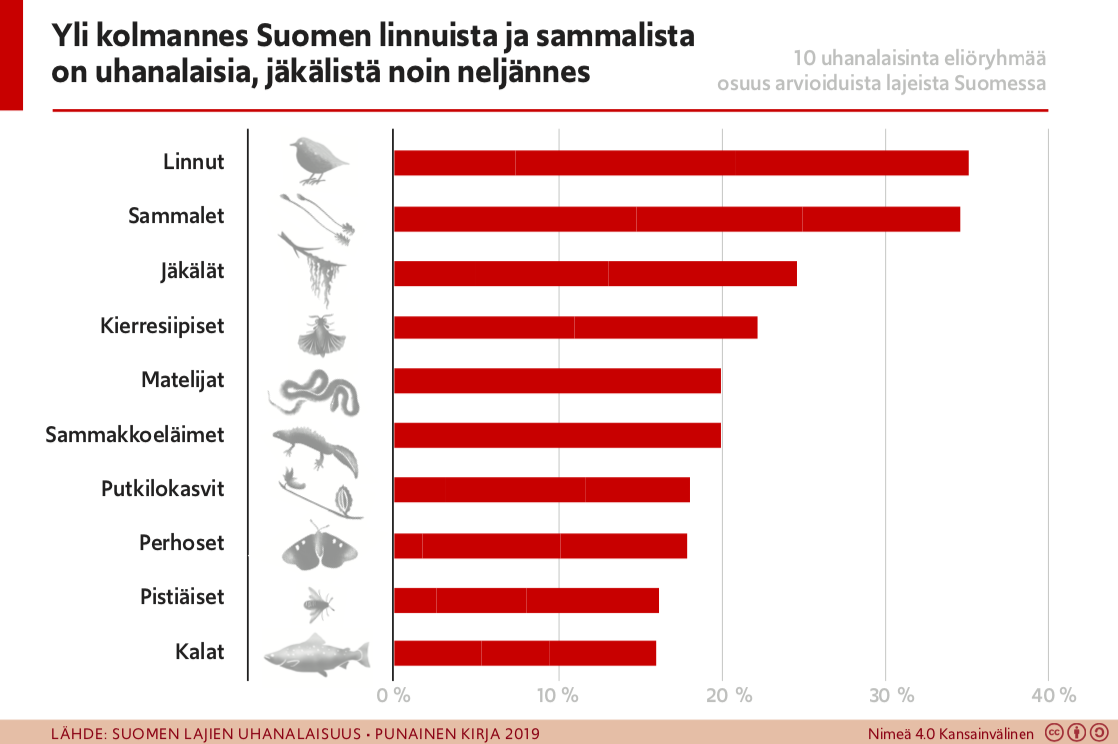
infographic. Static png image.

infographic. Static png image.